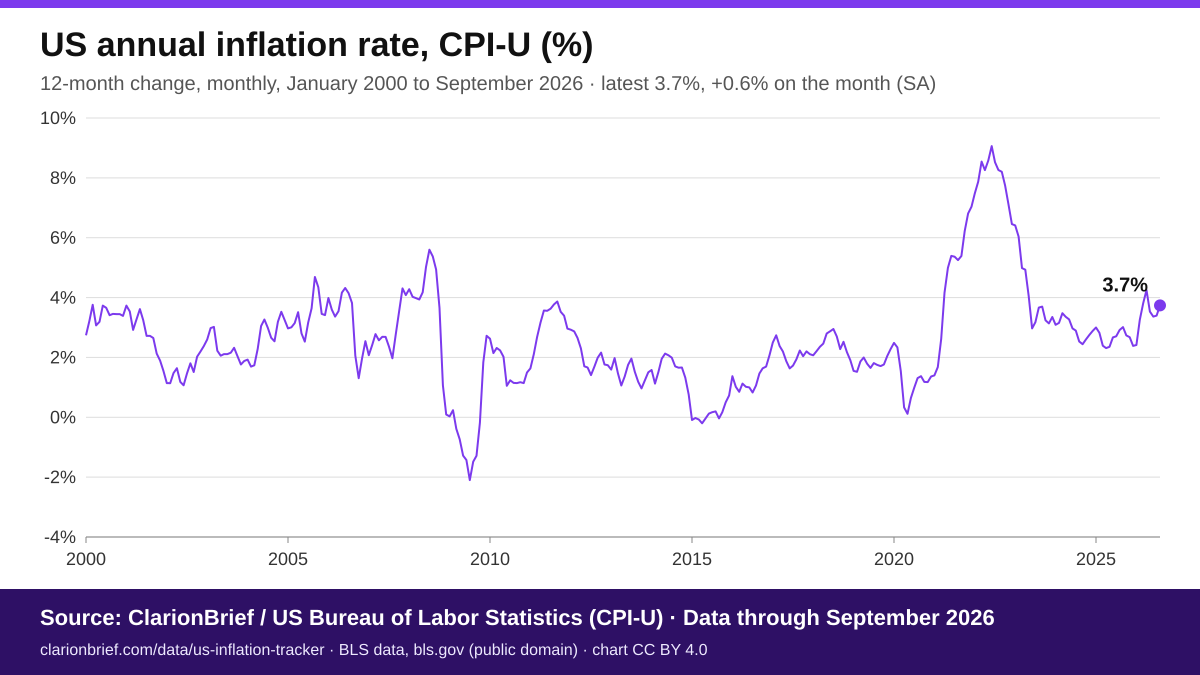
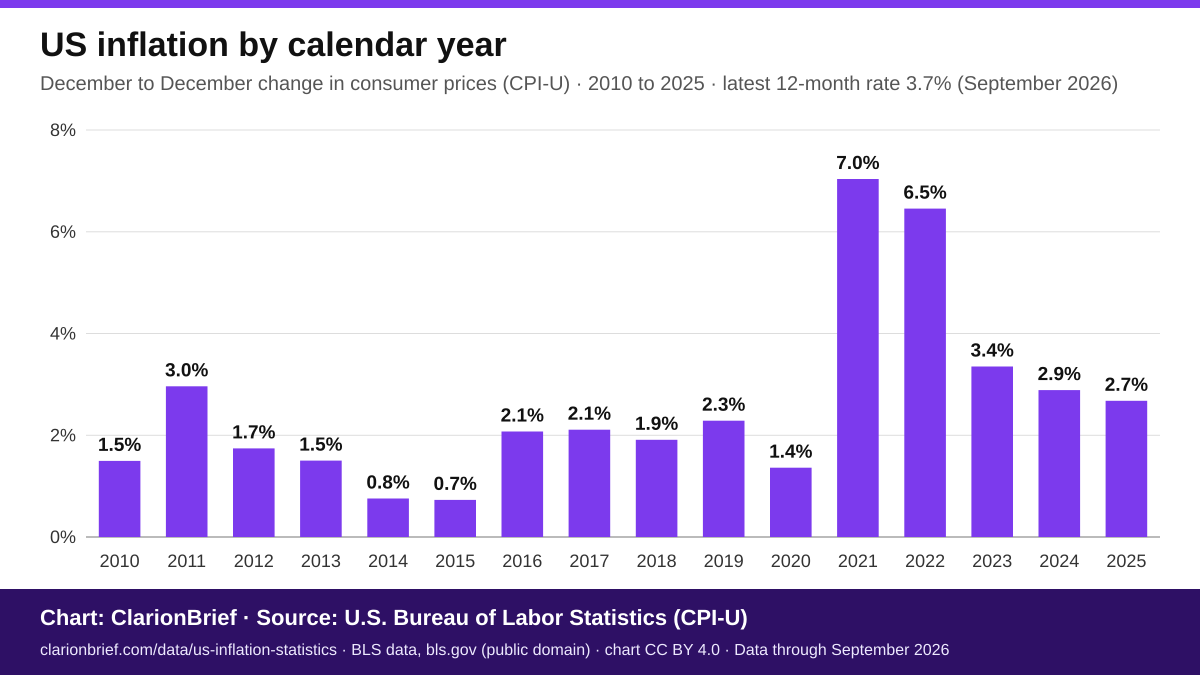
Consumer prices in the United States were 3.7% higher in September 2026 than a year earlier, according to the Bureau of Labor Statistics consumer price index for all urban consumers. On a seasonally adjusted basis prices changed +0.6% from the previous month.
Monthly inflation since 2000, a line chart and the full CPI-U series since 1999 as a CSV.
45 key figures on US consumer prices, each with its own link, plus December-to-December changes from 2000 to 2025.
Copy-ready citations, two CSV files and a downloadable bar chart.
Enter an amount and any year since 1913 to see what it is worth in September 2026 dollars, and how much prices have risen since.
For example, $100 in 2000 buys what $195.67 buys in September 2026.
Enter your earlier and current pay to see whether it kept up with prices since any year from 1913, and the raise needed to stand still.
Prices rose 3.7% in the 12 months to September 2026, so pay had to rise by 3.7% over that year just to keep up: a $50,000 salary in September 2025 needs to be $51,868.84 in September 2026.
How much prices rose under every president since March 1913, with yearly rates, rankings and a comparison of any two presidents at the same point in office.
The highest average inflation of any completed presidency since 1913 was under Jimmy Carter: 10.4% a year (January 1977 to January 1981). Since 1953 the next highest was under Gerald Ford, at 6.7% a year.
How much prices changed for 37 categories, from groceries, rent and gasoline to cars, airline fares and medical care, between any two months since January 2000, with a ranking of every category.
In the 12 months to September 2026, prices overall (all items) rose 3.7%. The biggest rises among the 37 categories were for Gasoline (all types) (+34.2%); Airline fares (+22.4%); and Energy (+20.4%); the lowest changes were for Medical care commodities (medicines and supplies) (−3.3%); Used cars and trucks (−1.5%); and Information technology commodities (computers, phones and software) (−1.1%).
The average 30-year and 15-year fixed mortgage rate in any month since April 1971, the monthly payment at that rate and a comparison of any two months.
In the week to 29 October 2026, the average 30-year fixed mortgage rate in the US was 7.24% and the 15-year rate was 6.60%. A year earlier (week of 30 October 2025) the 30-year rate was 6.17%, a change of +1.07 percentage points.
The official average price of eggs, milk, bread, ground beef, coffee, gasoline, electricity and 5 other items in any month since January 1980, with changes and record highs.
In September 2026, US city average prices were $2.27 for a dozen grade A large eggs, $4.11 for a gallon of whole milk, $6.79 for a pound of ground beef and $4.48 for a gallon of regular unleaded gasoline.
What Americans spend at stores, car dealers, gas stations, online retailers and restaurants: any month since January 1992, with and without autos, two months compared and the total for every year.
US retail sales were $745.0 billion in September 2026, up 6.3% on a year earlier.