
US inflation tracker
Consumer prices in the United States were 3.7% higher in September 2026 than a year earlier, according to the Bureau of Labor Statistics consumer price index for all urban consumers. On a seasonally adjusted basis prices changed +0.6% from the previous month.
Updated 4 November 2026. Source: U.S. Bureau of Labor Statistics, Consumer Price Index (CPI-U).
Key figures, records and yearly changes: US inflation statistics. What a past dollar is worth today: US inflation calculator. Did your pay keep up: salary inflation calculator. Prices under every president since 1913: inflation by president. Food, rent, gas and 34 other categories: price changes by category. What eggs, milk and gas cost in any month since 1980: US average prices.
Consumer price inflation, last 24 reported months
| Month | Annual change | Monthly change (SA) | Index (NSA) | Index (SA) |
|---|---|---|---|---|
| September 2026 | +3.7% | +0.6% | 336.940 | 336.298 |
| August 2026 | +3.4% | +0.4% | 334.980 | 334.131 |
| July 2026 | +3.4% | +0.1% | 333.918 | 332.813 |
| June 2026 | +3.5% | −0.4% | 333.952 | 332.568 |
| May 2026 | +4.2% | +0.5% | 335.123 | 333.979 |
| April 2026 | +3.8% | +0.6% | 333.020 | 332.407 |
| March 2026 | +3.3% | +0.9% | 330.213 | 330.293 |
| February 2026 | +2.4% | +0.3% | 326.785 | 327.460 |
| January 2026 | +2.4% | +0.2% | 325.252 | 326.588 |
| December 2025 | +2.7% | +0.3% | 324.054 | 326.031 |
| November 2025 | +2.7% | – | 324.122 | 325.063 |
| September 2025 | +3.0% | +0.3% | 324.800 | 324.245 |
| August 2025 | +2.9% | +0.3% | 323.976 | 323.291 |
| July 2025 | +2.7% | +0.2% | 323.048 | 322.169 |
| June 2025 | +2.7% | +0.3% | 322.561 | 321.435 |
| May 2025 | +2.4% | +0.1% | 321.465 | 320.620 |
| April 2025 | +2.3% | +0.2% | 320.795 | 320.302 |
| March 2025 | +2.4% | +0.0% | 319.799 | 319.785 |
| February 2025 | +2.8% | +0.2% | 319.082 | 319.679 |
| January 2025 | +3.0% | +0.4% | 317.671 | 318.961 |
| December 2024 | +2.9% | +0.3% | 315.605 | 317.604 |
| November 2024 | +2.7% | +0.3% | 315.493 | 316.528 |
| October 2024 | +2.6% | +0.3% | 315.664 | 315.631 |
| September 2024 | +2.4% | +0.2% | 315.301 | 314.732 |
How to read these figures
The consumer price index for all urban consumers (CPI-U) tracks the prices paid by urban households for a fixed basket of goods and services, including food, energy, housing, transport, medical care and electronics. It is compiled monthly by the US Bureau of Labor Statistics.
Annual inflation on this page is the 12-month change in the index before seasonal adjustment, the basis BLS uses for its headline yearly rate. Monthly changes use the seasonally adjusted index. Calculations are by ClarionBrief from the official index values and may differ from BLS-published percentages by a rounding difference.
No index value was published for October 2025, when BLS was unable to collect price data during the federal government shutdown; comparisons that need that month are left blank. Seasonally adjusted values are revised each February. The page is checked against the latest release every day.
Suggested source citation: U.S. Bureau of Labor Statistics, Consumer Price Index for All Urban Consumers: All Items in U.S. City Average [CPIAUCNS, CPIAUCSL], retrieved from FRED, Federal Reserve Bank of St. Louis.
Download and reuse
The full series is free to download as CSV. BLS data are in the public domain. You may reuse this compilation and chart with credit to ClarionBrief and BLS, linking to this page, under CC BY 4.0.
Download chart
A ready-to-use image of the annual inflation rate since 2000, with the source credit printed on the chart. It is updated daily with the tracker and currently shows data through September 2026. No index value was published for October 2025, so the line joins the months either side.
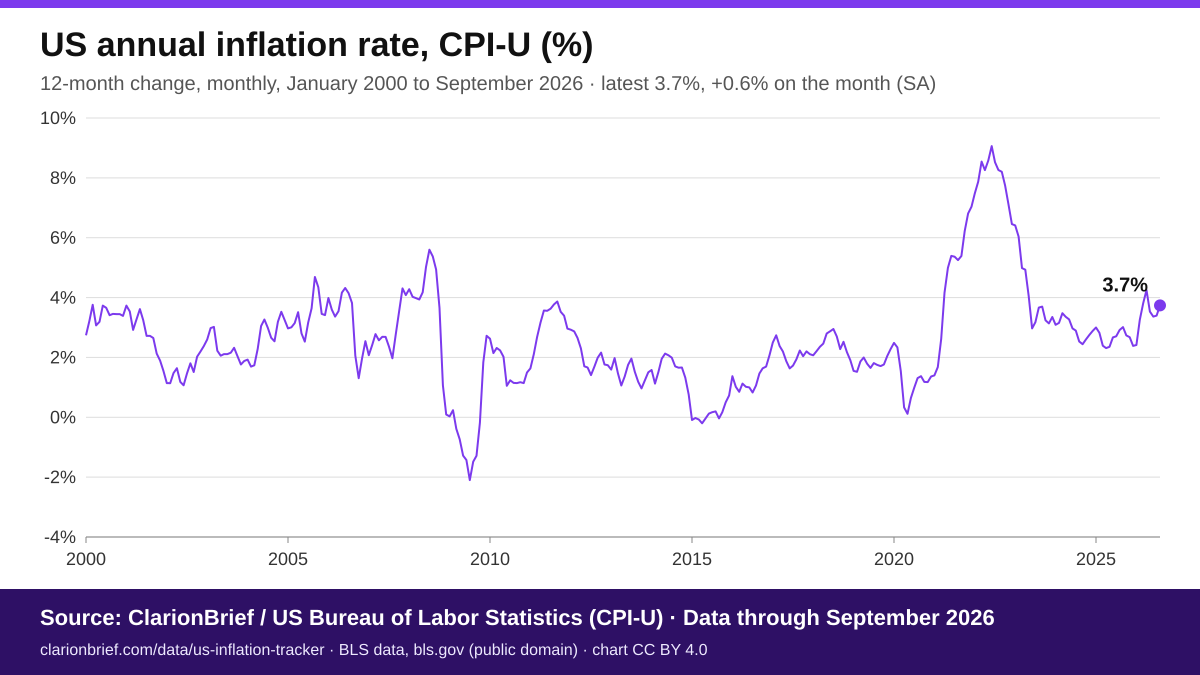
Download chart (PNG, 1200 × 675 px) · SVG version
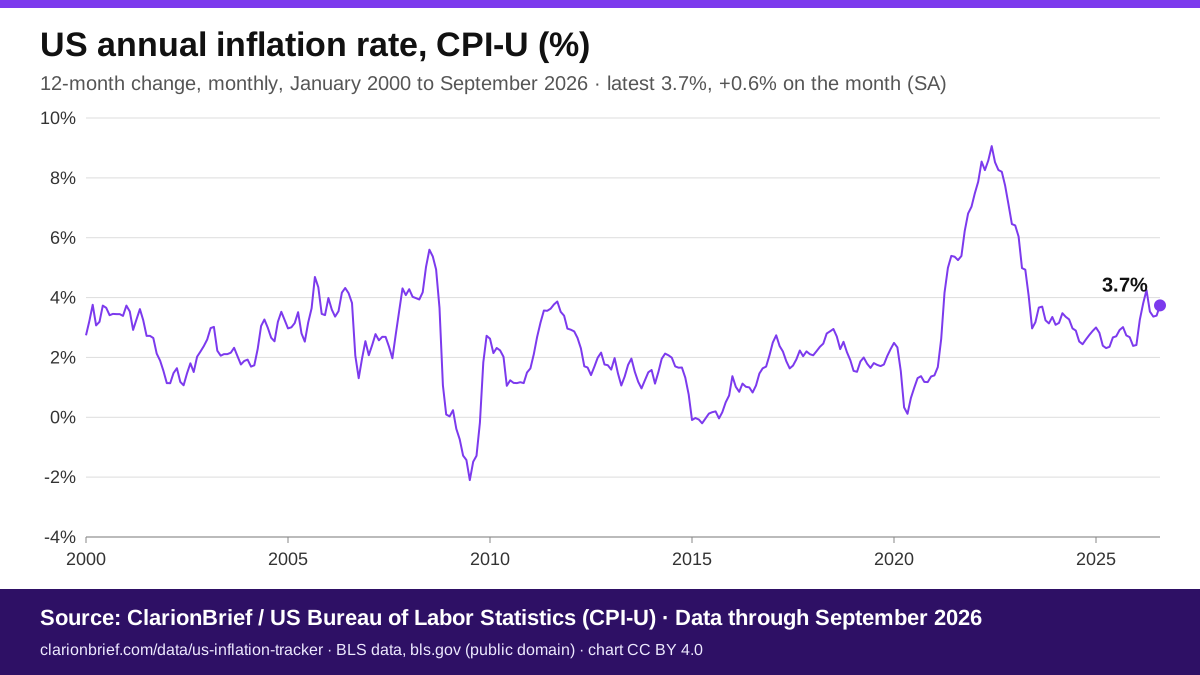
BLS data are in the public domain. You may reuse the chart under a CC BY 4.0 licence with credit to ClarionBrief and the US Bureau of Labor Statistics, linking to this page. Please keep the credit line on the image. To publish it, copy this code:
Embed the chart
Copy this code to publish the always-current chart on your own site. Please keep the credit link.