
US inflation statistics 2026
US consumer prices rose 3.7% in the year to September 2026. Below are 45 key statistics on the current inflation rate, its highs and lows, yearly changes since 2000, decade averages and the purchasing power of the dollar, each calculated from official consumer price index figures and linkable on its own.
Updated 4 November 2026. Source: U.S. Bureau of Labor Statistics, Consumer Price Index (CPI-U). Monthly chart and full data: US inflation tracker. Compare any two years: US inflation calculator. Did your pay keep up: salary inflation calculator. Prices under every president since 1913: inflation by president. Food, rent, gas and 34 other categories: price changes by category. Download these figures: key figures (CSV) · by year (CSV).
Latest figures
- US consumer prices were 3.7% higher in September 2026 than a year earlier, based on the CPI-U for all items before seasonal adjustment. #
- On a seasonally adjusted basis, prices rose 0.6% from the previous month in September 2026. #
- The annual rate was 3.4% in August 2026, so it rose in the latest month. #
- A year earlier, in September 2025, the annual rate was 3.0%; two years earlier, in September 2024, it was 2.4%. #
- The CPI-U index stood at 336.940 in September 2026 (1982 to 1984 = 100, not seasonally adjusted). #
Highs and lows since 2000
- The highest annual inflation rate since 2000 was 9.1%, in June 2022. #
- The lowest was -2.1%, in July 2009. #
- Prices were lower than a year earlier in 14 months since January 2000, most recently in September 2015. #
- The peak of the post-2020 inflation surge was 9.1% in June 2022; the rate in September 2026 is 5.3 percentage points below it. #
- Annual inflation has been above 2% in every reported month since March 2021. #
Inflation by calendar year (December to December)
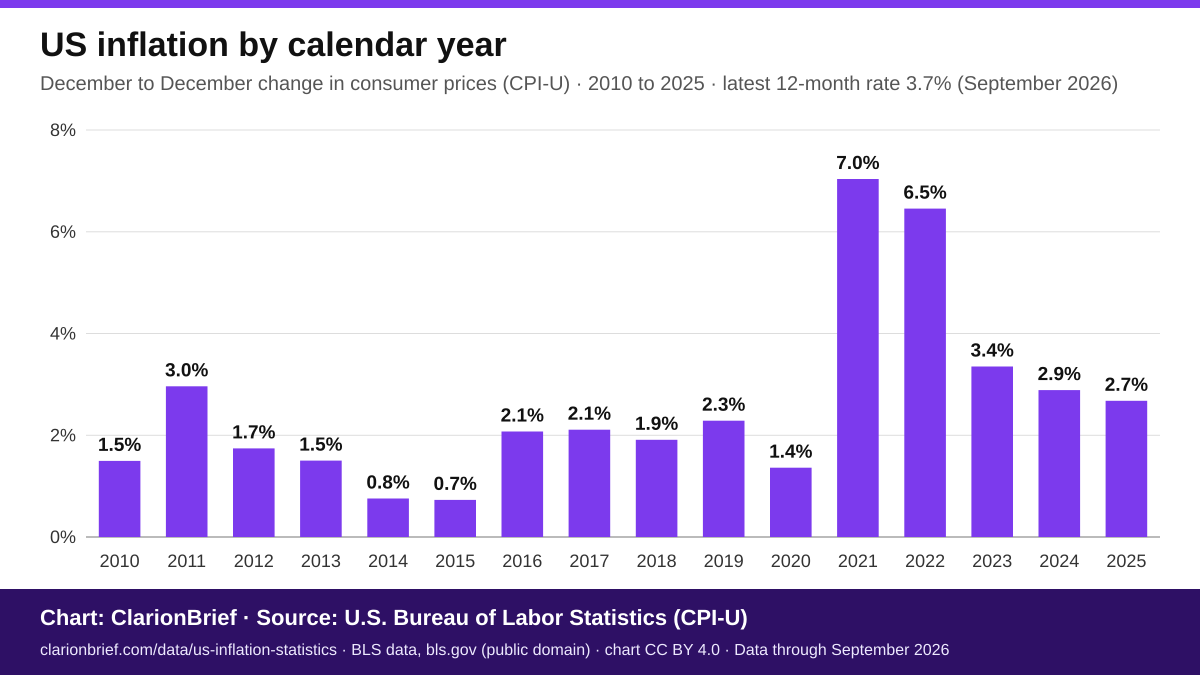
- 2025: consumer prices rose 2.7% from December 2024 to December 2025. #
- 2024: consumer prices rose 2.9% from December 2023 to December 2024. #
- 2023: consumer prices rose 3.4% from December 2022 to December 2023. #
- 2022: consumer prices rose 6.5% from December 2021 to December 2022. #
- 2021: consumer prices rose 7.0% from December 2020 to December 2021. #
- 2020: consumer prices rose 1.4% from December 2019 to December 2020. #
- 2019: consumer prices rose 2.3% from December 2018 to December 2019. #
- 2018: consumer prices rose 1.9% from December 2017 to December 2018. #
- 2017: consumer prices rose 2.1% from December 2016 to December 2017. #
- 2016: consumer prices rose 2.1% from December 2015 to December 2016. #
- 2015: consumer prices rose 0.7% from December 2014 to December 2015. #
- 2014: consumer prices rose 0.8% from December 2013 to December 2014. #
- 2013: consumer prices rose 1.5% from December 2012 to December 2013. #
- 2012: consumer prices rose 1.7% from December 2011 to December 2012. #
- 2011: consumer prices rose 3.0% from December 2010 to December 2011. #
- 2010: consumer prices rose 1.5% from December 2009 to December 2010. #
- 2009: consumer prices rose 2.7% from December 2008 to December 2009. #
- 2008: consumer prices rose 0.1% from December 2007 to December 2008. #
- 2007: consumer prices rose 4.1% from December 2006 to December 2007. #
- 2006: consumer prices rose 2.5% from December 2005 to December 2006. #
- 2005: consumer prices rose 3.4% from December 2004 to December 2005. #
- 2004: consumer prices rose 3.3% from December 2003 to December 2004. #
- 2003: consumer prices rose 1.9% from December 2002 to December 2003. #
- 2002: consumer prices rose 2.4% from December 2001 to December 2002. #
- 2001: consumer prices rose 1.6% from December 2000 to December 2001. #
- 2000: consumer prices rose 3.4% from December 1999 to December 2000. #
Average inflation by decade
What prices have done to a dollar
- Goods and services that cost $100 in January 2000 cost about $199.61 in September 2026, a rise of 99.6%. #
- Goods and services that cost $100 in January 2010 cost about $155.50 in September 2026, a rise of 55.5%. #
- Goods and services that cost $100 in January 2020 cost about $130.61 in September 2026, a rise of 30.6%. #
- Goods and services that cost $100 in September 2021 cost about $122.83 in September 2026, a rise of 22.8%. #
- Goods and services that cost $100 in September 2025 cost about $103.74 in September 2026, a rise of 3.7%. #
- A dollar in September 2026 buys about 50 cents' worth of what it bought in January 2000. #
Download chart
A ready-to-use image of US inflation in each calendar year from 2010 to 2025 (December to December), with the source credit printed on the chart. It is updated daily with this page and currently uses data through September 2026.
Download chart (PNG, 1200 × 675 px) · SVG version
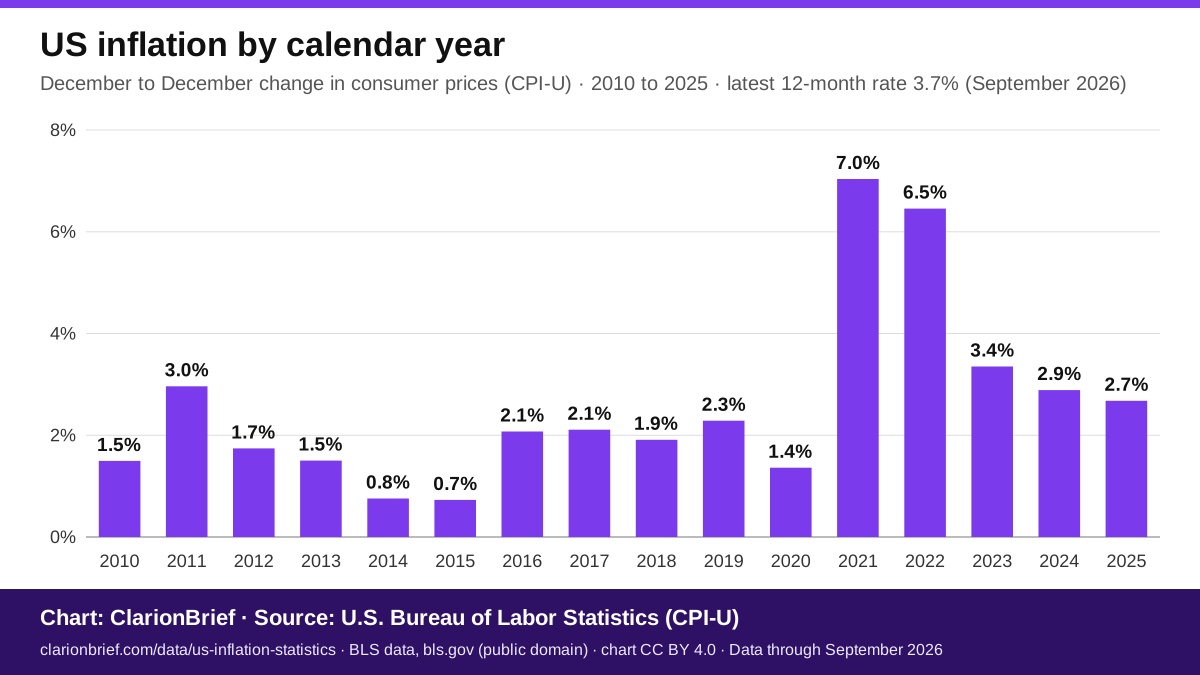
The figures are December-to-December changes in the CPI-U for all items, calculated by ClarionBrief from Bureau of Labor Statistics data, which is in the public domain. You may reuse the chart under CC BY 4.0 with credit to ClarionBrief and a link to this page, keeping the source line "U.S. Bureau of Labor Statistics". Please keep the credit line on the image. To publish it, copy this code:
Download the data
The figures on this page are free to download as CSV files, built from the same CPI-U data as the page and updated daily with it:
- US inflation key figures (CSV): all 45 statistics above, with the value, unit, period, full statement and a direct link to each figure.
- US inflation by calendar year (CSV): December CPI-U index levels and December-to-December changes for 2000 to 2025 (26 years).
The full monthly series since 1999 is on the US inflation tracker. You may reuse these files with credit to ClarionBrief and the Bureau of Labor Statistics and a link to this page, under CC BY 4.0.
Cite this page
You are welcome to quote any statistic here with a link to this page. Each figure has its own link (the # after it) so you can point readers to the exact number, and a "Copy citation" button that copies the figure with its source and link.
Embed the latest inflation rate
Copy this HTML to show the headline figure on your own site or newsletter. It is plain HTML with no scripts. The number is fixed when you copy it, so copy it again after each monthly CPI release. Please keep the credit link.
How these figures are calculated
All figures come from the consumer price index for all urban consumers (CPI-U), all items, US city average, published monthly by the Bureau of Labor Statistics. Annual rates are 12-month changes in the index before seasonal adjustment, the basis of the headline yearly rate. Monthly changes use the seasonally adjusted index.
Calendar-year figures compare December with the previous December. Decade averages are compound annual rates between the two end months. Purchasing-power figures scale prices by the ratio of index levels. Calculations are by ClarionBrief and can differ from BLS-published percentages by a rounding difference.
BLS published no index value for October 2025, when price collection stopped during the federal government shutdown, so comparisons that need that month are left out.
This page is refreshed with each monthly CPI release. Seasonally adjusted values are revised each February.